Exporting Data
Finally, it's time to turn our generated files into plots which we can use for our analysis. First, we create the R scripts to create the plots. Second, we automate the entire pipeline using make.
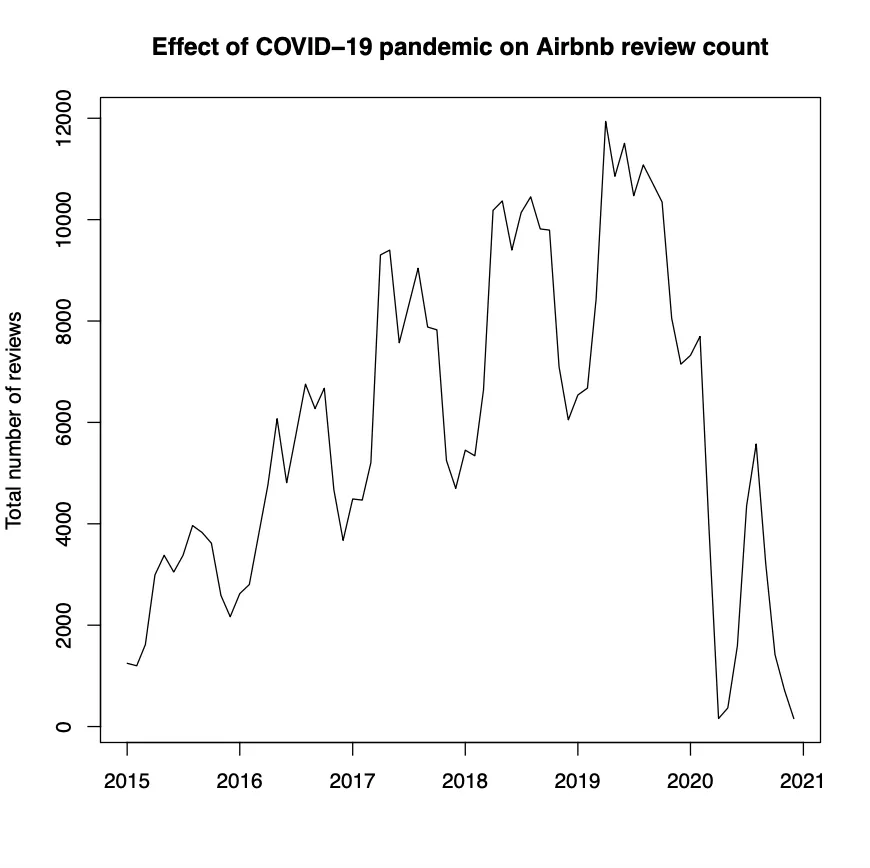
plot_all.R
A time-series plot that shows the total number of reviews over time (across all neighborhoods). Add a plot title and axes labels to make your graph easier to read. Store it as plot_all.pdf in gen/plots (don't forget to add a plots folder in gen!).
- Import the data from
gen/data-preparation/aggregated_df.csv - Convert the
datecolumn into date format. - Group by date and calculate the sum of all reviews across neighborhoods.
- Plot the chart and store the visualisation.
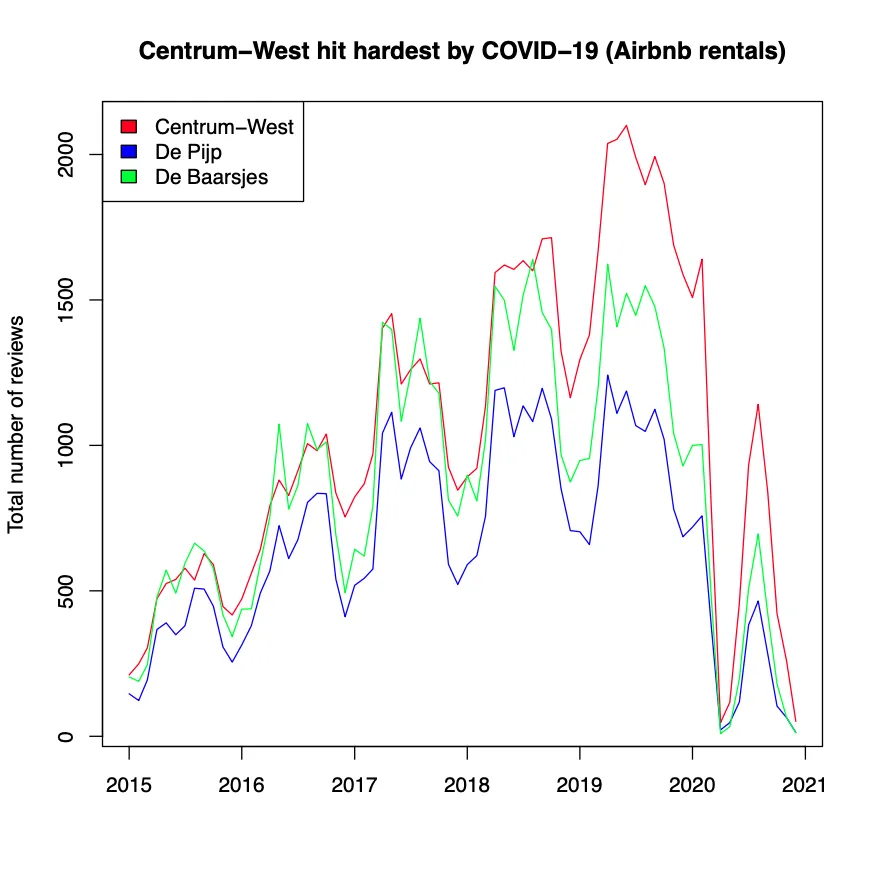
plot_Amsterdam.R
A time-series plot that shows the total number of reviews over time for the top 3 neighborhoods (Centrum-West, De Pijp - Rivierenbuurt, and De Baarsjes - Oud-West). Add a plot title, axes labels, and a legend to make your graph easier to read. Store it as plot_Amsterdam.pdf in gen/plots.
- Import the data from
gen/data-preparation/pivot_table.csv - Convert the
datecolumn into date format. - Plot the chart and store the visualisation.