


Overview
Quarto is an open-source scientific and technical publishing system that enables you to create and share interactive documents, presentations, dashboards, and reports. It doesn't provide a standalone graphical user interface but is built to integrate with tools like Visual Studio Code, Jupyter, RStudio. It supports Markdown alongside executable code blocks in multiple programming languages, such as R, Python, and Julia. This guide will walk you through creating your first document.
 Tip
TipRefer to our Quarto Set-up Guide for detailed instructions on installing Quarto.
What is Quarto
Quarto is a powerful publishing system that uses Markdown to author content. It allows you to seamlessly blend narrative text and executable code chunks within a single file. This makes it ideal for creating interactive tutorials, sharing reproducible research results, and delivering impactful communication.
Key advantages of Quarto are:
-
Integrated code and text: Combine text, code snippets, and visualizations in a single document.
-
Versatile data science tool: Quarto supports multiple programming languages, including R, Python, and Julia, and integrates smoothly with environments like VS Code, RStudio, and Jupyter Notebooks.
-
Various output formats: Generate documents in formats like HTML, PDF, Word, and PowerPoint, all without needing to adjust the document's syntax for each format.
-
Interactive features: Incorporate interactive elements like Shiny apps and widgets directly into your documents.
Use Quarto with VS Code
- Install the Quarto VS Code Extension
- Open the Extensions Marketplace in VS Code, using the shortcut
Ctrl+Shift+X(CMD+Shift+Xon Mac), or click the Extensions icon on the left sidebar:
- Open the Extensions Marketplace in VS Code, using the shortcut
![]()
- Search for "Quarto" in the search bar.
-
Click the blue "Install" button.
-
Create a
.qmd(Quarto Markdown) file. -
Navigate to the File menu and select "New File"
-
Type "Quarto", then choose "Quarto Document" from the available options.
-
Adding content:
Metadata
Start by setting up your document's metadata in the YAML block at the top of your Quarto file, for example:

---
title: "My First Quarto Document"
author: "Your Name"
date: "2024-08-15"
format:
  html:
    code-fold: true
---
This section defines key information, including the title, author, date, and output format. Setting code-fold: true collapses the code into a clickable tab.
Markdown text
You can add text using Markdown syntax, for example to introduce your content and explain your code.
TipCommon Markdown features:
- Bold text: Use double asterisks (
**) - Italic text: Use single asterisks (
*) - Create headers with
## - Create lists by using
-or*
Code blocks
Code blocks are enclosed in three backticks (<div class="highlight"><pre class="chroma"><code class="language-fallback" data-lang="fallback">) with the language specified in curly braces ({}).
Examples
Create a plot in Python
To create a Quarto document with Python code, follow these steps:
- Add
jupyter: python3to the metadata section to specify the kernel. -
Ensure you have
matplotlibinstalled. If not, use the following command in the terminal:- For Windows:
py -m pip install matplotlib - For Mac:
python3 -m pip install matplotlib
- For Windows:
-
Insert the following content into your Quarto document, replacing the escaped backticks around the Python code block (
\`\`\`) with normal backticks (</code></pre></div>).
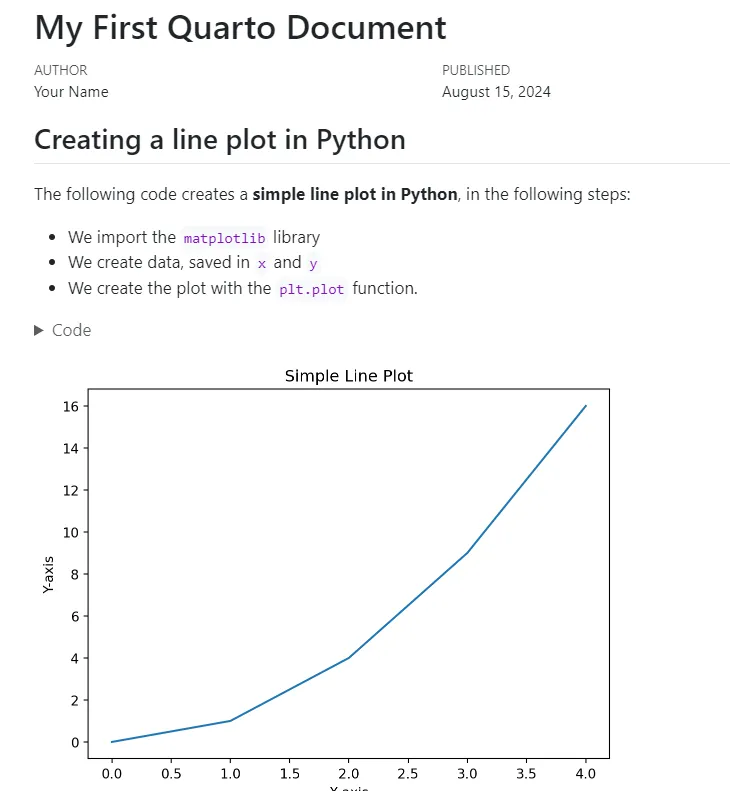
## Creating a line plot in Python

We demonstrate how to create a simple line plot in Python, in the following steps:

- We import the `matplotlib` library
- We create data, saved in `x` and `y`
- We create the plot with the `plt.plot` function.

\`\`\`{python}
import matplotlib.pyplot as plt

# Data for plotting
x = [0, 1, 2, 3, 4]
y = [0, 1, 4, 9, 16]

# Create the plot
plt.plot(x, y)
plt.title("Simple Line Plot")
plt.xlabel("X-axis")
plt.ylabel("Y-axis")
plt.show()
\`\`\`
You can execute a code cell without rendering the entire document. Simply click "Run Cell", and the plot will appear in a new tab.
Create a plot in R:
As an example, the following steps create a Quarto document with R code creating a plot:
-
Install the R extension in VS Code, by navigating to the Extensions tab, selecting the R extension, and clicking "Install"
-
Install the required R packages (e.g.,
ggplot2). It's best practice to avoid installing packages directly within a Quarto document, as this would cause the installation to be repeated every time the document is rendered. Instead, install the packages in your terminal or within RStudio to keep your Quarto document clean. -
Add the following Markdown and R code block to your Quarto file, replacing the escaped backticks around the R code block (
\`\`\`) with normal backticks (```).
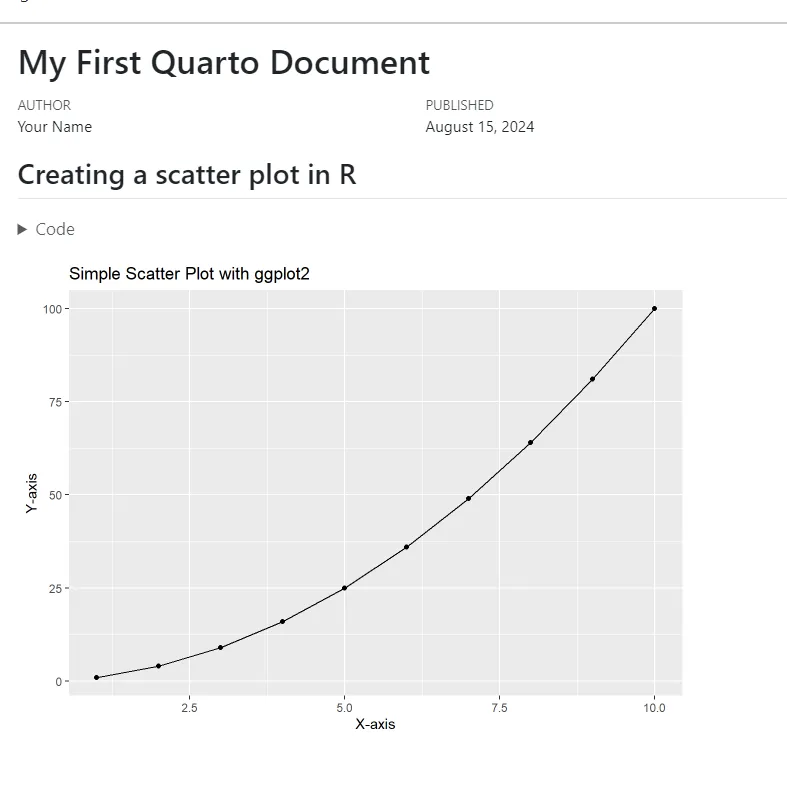
## Creating a scatter plot in R

\`\`\`{r}
#| echo: true
#| message: false
#| warning: false

# Load ggplot2 for plotting
library(ggplot2)

# Create a simple scatter plot
data <- data.frame(x = 1:10, y = (1:10)^2)

ggplot(data, aes(x = x, y = y)) +
  geom_point() +
  geom_line() +
  ggtitle("Simple Scatter Plot with ggplot2") +
  xlab("X-axis") +
  ylab("Y-axis")
\`\`\`
Code block options are added using #|. For example, you can label the code chunk, or control how code, messages, and warnings are handled:
- Use
label:to give the code chunk a descriptive name. - Use
echo: trueto display the code in the output. - Use
message: falseto hide any messages generated by the code. - Use
warning: falseto hide warnings in the output.
- Render and preview
To preview your document with a plot created in either R or Python:
- Click on the three dots in the upper-right corner of the file, then click "Preview" (Shortcut:
Ctrl+Shift+Kfor Windows, orcmd+Shift+Kfor Mac). - The document will open in a new tab in VSCode, or you can
Ctrl+Clickthehttp://localhostlink to preview the HTML version in a web browser.
Here's the output in HTML format from the example (the code is hidden under the Code tabs):
|
|
TipYou can render your document in various formats by adjusting the format: section in the metadata. Some common options include:
- pdf
- docx: Word document
- revealjs: slide deck
Combining R and Python in the same Quarto document
You can combine R and Python in the same Quarto document with just a few extra steps.
For example, if your document primarily uses R code blocks, the engine will default to knitr. To run Python code in this environment, you can use the reticulate R package, which allows you to execute Python code directly from the R console.
 Warning
If your document contains mostly Python code, it's best to use the Jupyter engine instead. If you need to run R code from a Jupyter engine, you can do so using the rpy2 package in Python.
Here's an example of a Quarto file that combines R and Python:
---
title: "Combining R and Python"
author: "Your Name"
date: "2024-08-15"
format:
html:
code-fold: true
---
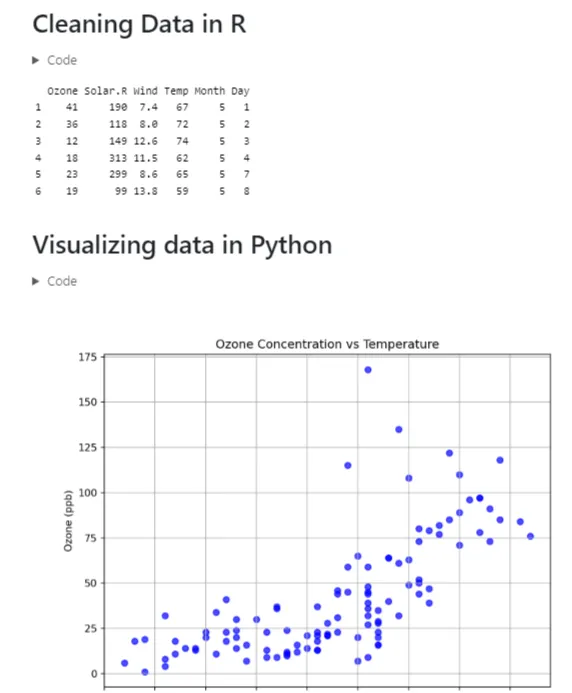
# Cleaning Data in R
In this example, the r. prefix in the Python code block allows you to access the R object cleaned_data for use in Python.
The rendered HTML output:
Use Quarto with JupyterLab
Quarto can be used within JupyterLab to work with .ipynb files (Python notebooks). To get started, refer to this guide.
The process is very similar to using Quarto with VS Code. You can render notebooks from the Jupyter terminal using commands like quarto preview example-file.ipynb, which will open the output in a new tab. You can also define the desired output format and other options in the YAML metadata section at the top of the notebook.
Use Quarto with RStudio
To set up Quarto with RStudio, refer to this page. The basic workflow is simple:
- Open a
.qmdfile in RStudio by selecting "File" -> "New File" -> "Quarto Document". - Preview the file by clicking the "Render" button, which you can find either in the toolbar above the document (button with a blue arrow) or under the "File" tab.
-
The output will open in a new tab in your web browser, or copy the
http://localhostlink to view the preview. Summary
Quarto is a powerful tool that blends Markdown with executable code blocks. This guide helps you get started with your first Quarto document. As you become more skilled with Quarto, learn how to automate a report with streaming data next!